Report library
36 reports, built in
21 for brands and 15 for 3PLs. Every report can compare periods, filter, export to CSV, print to PDF, be saved as a view and be emailed on a schedule.
Brand report group · 7
Inventory health
What you have, what is about to run out, and what is sitting too long.
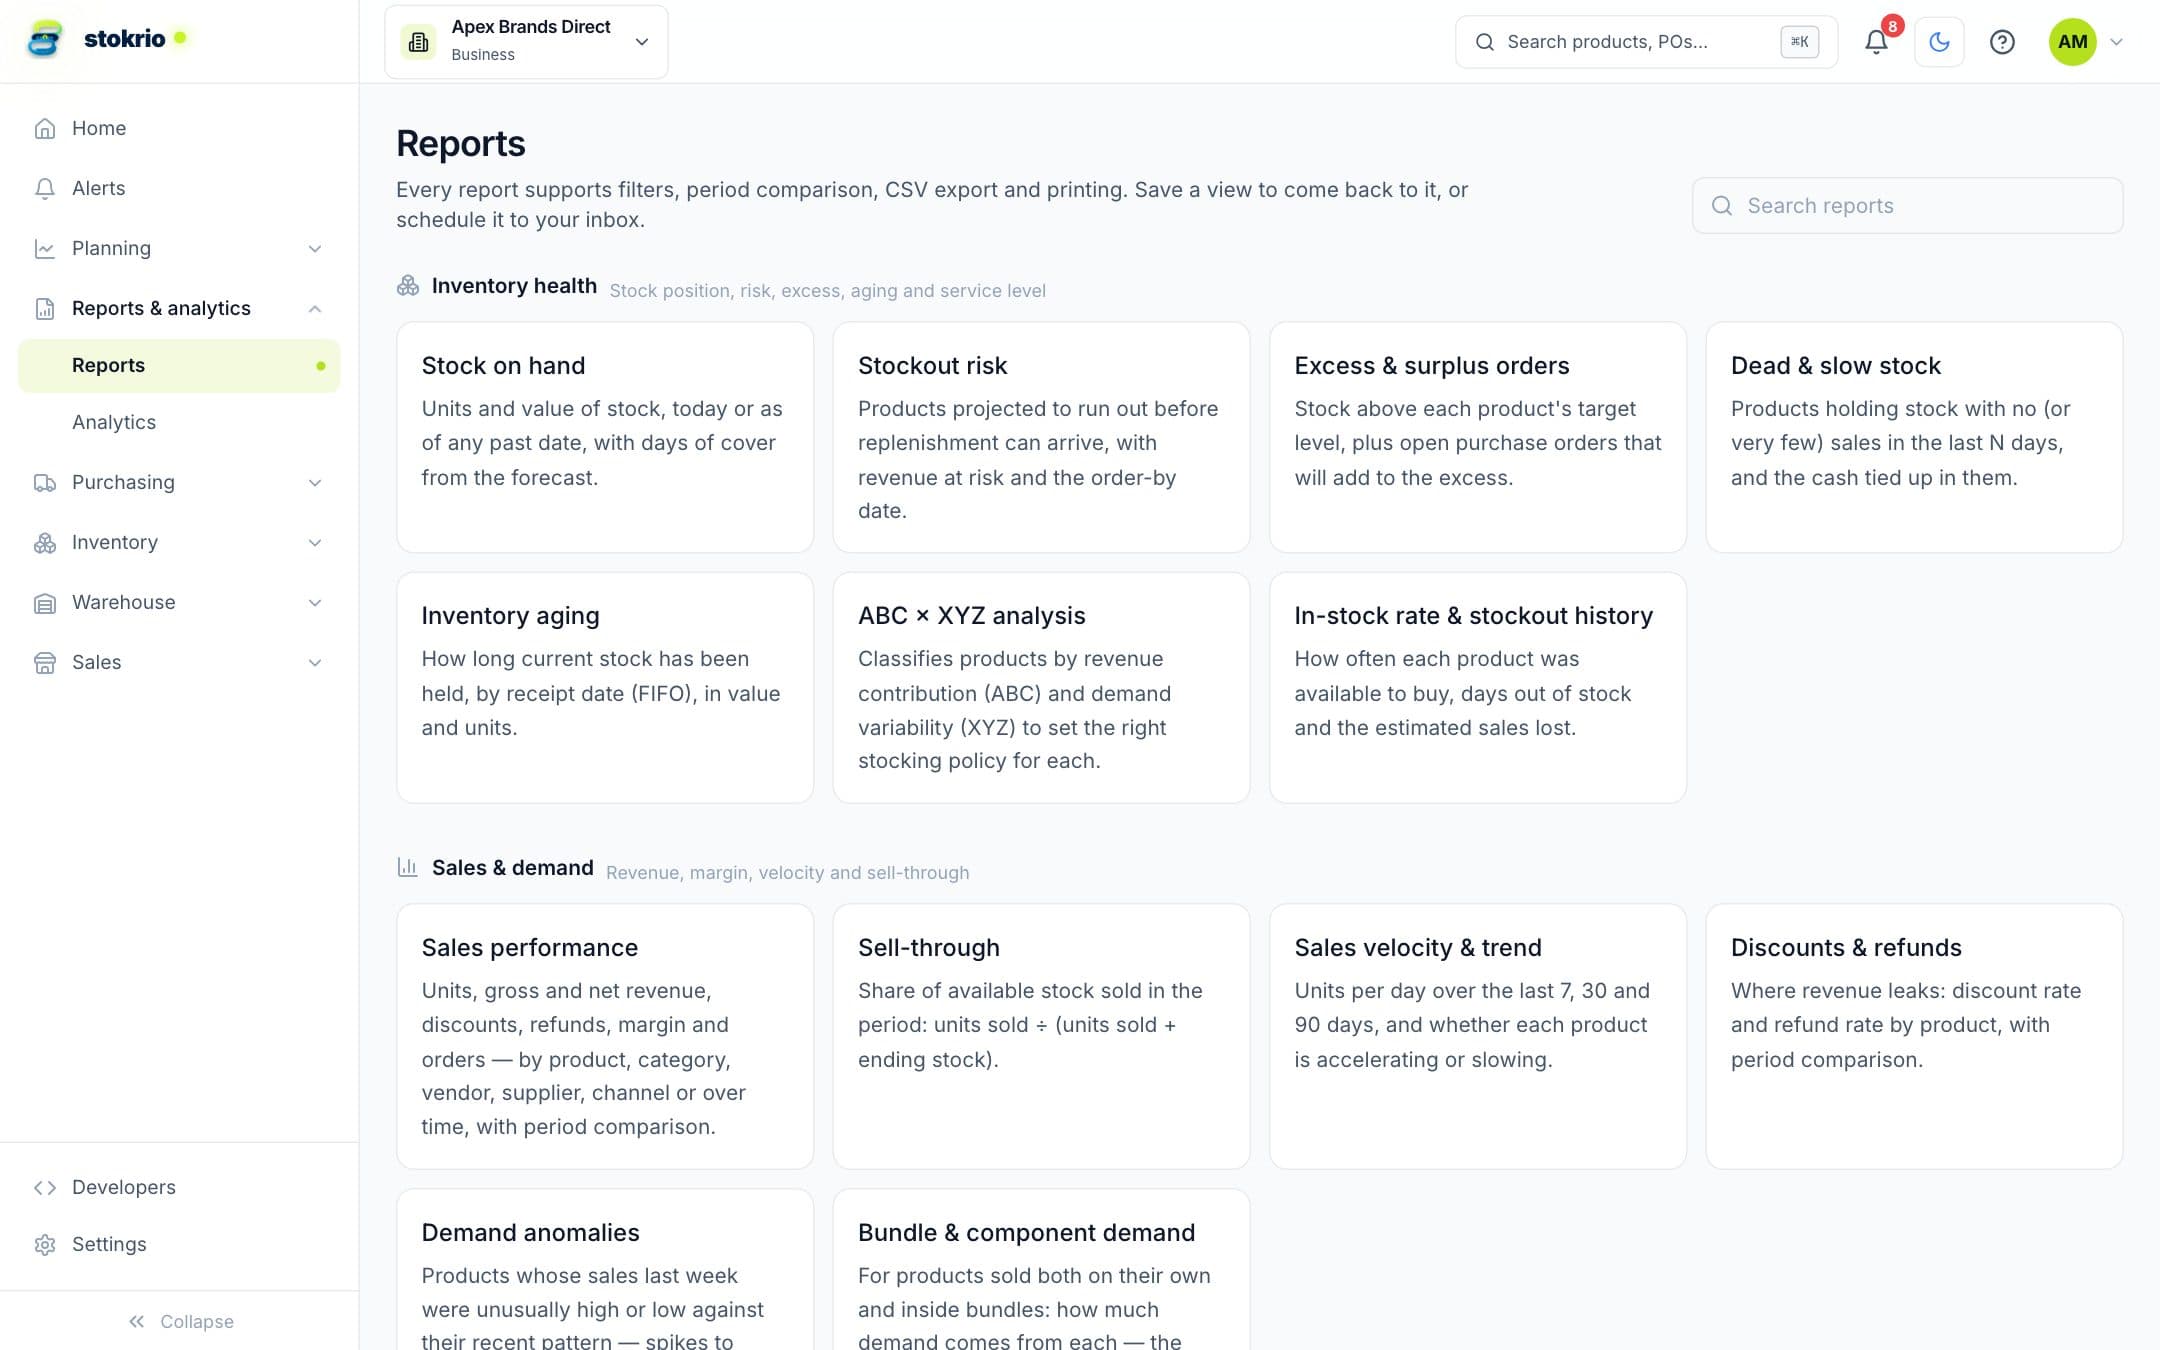
Stock on hand
BrandUnits and value of stock, today or as of any past date, with days of cover from the forecast.
Stockout risk
BrandProducts projected to run out before replenishment can arrive, with revenue at risk and the order-by date.
Excess & surplus orders
BrandStock above each product's target level, plus open purchase orders that will add to the excess.
Dead & slow stock
BrandProducts holding stock with no (or very few) sales in the last N days, and the cash tied up in them.
Inventory aging
Financial roleHow long current stock has been held, by receipt date (FIFO), in value and units.
ABC × XYZ analysis
BrandClassifies products by revenue contribution (ABC) and demand variability (XYZ) to set the right stocking policy for each.
In-stock rate & stockout history
BrandHow often each product was available to buy, days out of stock and the estimated sales lost.
Brand report group · 6
Sales & demand
What sells, how fast, and where revenue leaks.
Sales performance
BrandUnits, gross and net revenue, discounts, refunds, margin and orders — by product, category, vendor, supplier, channel or over time, with period comparison.
Sell-through
BrandShare of available stock sold in the period: units sold ÷ (units sold + ending stock).
Sales velocity & trend
BrandUnits per day over the last 7, 30 and 90 days, and whether each product is accelerating or slowing.
Discounts & refunds
BrandWhere revenue leaks: discount rate and refund rate by product, with period comparison.
Demand anomalies
BrandProducts whose sales last week were unusually high or low against their recent pattern — spikes to investigate (viral, promo, wholesale) and drops to explain (stockout, listing issue).
Bundle & component demand
BrandFor products sold both on their own and inside bundles: how much demand comes from each — the true usage the forecast plans for.
Brand report group · 4
Purchasing & suppliers
What is on order, who delivers on time, and what the materials need.
Supplier performance
BrandOn-time and in-full delivery, actual vs quoted lead time and its variability, and spend per supplier.
Purchase spend
Financial rolePurchase order value by month and supplier, with what's still open.
Incoming & overdue POs
BrandEvery open purchase order line with its expected date, days overdue and value still to arrive.
Material requirements
BrandRaw materials and sub-assemblies: demand from the forecasts of the products that use them, cover, shortfall and what to order.
Brand report group · 2
Financial
How hard the money in stock is working.
Inventory value over time
Financial roleDaily stock value at cost and units on hand, from end-of-day snapshots.
Turnover, days of inventory & GMROI
Financial roleHow hard inventory works: turns, days of inventory on hand and gross margin return on inventory investment.
Brand report group · 2
Forecasting
How good the forecasts are, and the plan they produce.
Forecast accuracy
BrandPast forecasts compared with what actually sold over the following 28 days, by product.
Monthly demand plan
BrandForecast units and revenue per product for the next months — the baseline for buying and budgeting.
15 3PL reports
3PL
Built for logistics providers: per client and per warehouse, in units.
Client overview
3PLEach client's products, units held, orders in the last 30 days and out-of-stock lines.
Warehouse throughput
3PLOrders, lines and units shipped, units received, returns and corrections, by client, warehouse or period. For labour planning.
Order fulfilment
3PLOrders placed against shipped, what's still open, and how quickly orders ship (within 24 and 48 hours, median hours), by client or warehouse.
Inbound schedule
3PLOpen purchase orders due into your warehouses: what arrives when, from whom, for which client, and what's overdue. Your dock plan.
Receiving performance
3PLPurchase orders completed in the period: on time against the expected date, short and over receipts, fill rate and lead time, by client, supplier or warehouse.
Receipts and returns log
3PLEvery receipt and return put away in the period: when, client, warehouse, SKU, units, reference and lot.
Storage by client
3PLAverage, peak and closing units stored, SKUs held and unit-days per client and warehouse, from end-of-day stock. A basis for storage charges.
Bin utilisation
3PLBins in use and empty by warehouse and zone (or aisle), and which clients occupy them. Right now.
Slow and dead stock by client
3PLStock taking up space: products with no shipments in the window (dead) or more than six months of cover at the recent rate (slow).
Expiry exposure
3PLLots in your warehouses that have expired or expire within the window, by client, SKU, lot and bin.
Count and adjustment differences
3PLHow often and by how much stock was corrected (stock counts, adjustments, syncs), by client, warehouse, product or reason.
Client activity summary
3PLPer client for the period: orders and units shipped, receipts and units received, returns, corrections, and average and peak storage. Counts to support invoicing.
Client growth
3PLEach client month by month: orders shipped, units shipped or average units stored, with the change on the previous month.
Client stockout risk
3PLProducts out of stock or running out for each client, from their own forecasts. A prompt for account managers.
Integration health
3PLPer client: when your system last sent data, the last stock count and order, partner API calls and errors in the last 7 days.
Shopify App · 3PL Partner API · US$39/mo entry plan
Run these on your own data
Connect your store and every report fills from your orders, stock and purchase orders.